
Quantitative Comparison of Learning Environment Effect
[ad_1]
CHAPTER 4: DATA ANALYSIS AND INTERPRETATION
4.1 INTRODUCTION
This chapter presents the data analysis and interpretation also purpose of this study was to compare the learning of developmental mathematics course which received instruction in two different environments to determine whether mathematic online course enhanced their learning. Specifically, the study investigated whether there was a significant difference in mathematics online course as measured by the exam of students enrolled in mathematic classes receiving traditional instruction, with online instruction. The Statistical Package for the Social Sciences (SPSS) was used for the analysis with an alpha = .05 level of significance.
4.2 T-Test: Paired Two Samples for Means:
Paired data tests engage taking exam score without online course and with online course students participate the mathematic course from the same large number (n=60) of object and operating a hypothesis test on the differences between the without online course and with online course samples.
TABLE 1 student’s result
|
No Students |
Without _Online _Course |
With_Online_Course |
|
1 |
4 |
15 |
|
2 |
5 |
25 |
|
3 |
9 |
30 |
|
4 |
10 |
14 |
|
5 |
10 |
30 |
|
6 |
11 |
26 |
|
7 |
11 |
29 |
|
8 |
12 |
15 |
|
9 |
12 |
28 |
|
10 |
13 |
5 |
|
11 |
14 |
14 |
|
12 |
14 |
17 |
|
13 |
14 |
21 |
|
14 |
15 |
9 |
|
15 |
15 |
15 |
|
16 |
15 |
16 |
|
17 |
15 |
29 |
|
18 |
15 |
30 |
|
19 |
16 |
28 |
|
20 |
17 |
9 |
|
21 |
17 |
30 |
|
22 |
18 |
15 |
|
23 |
19 |
30 |
|
24 |
21 |
11 |
|
25 |
23 |
12 |
|
26 |
25 |
23 |
|
27 |
25 |
26 |
|
28 |
27 |
29 |
|
29 |
28 |
30 |
|
30 |
30 |
30 |
4.3 SPSS Annotated Output:
The paired samples t-test is hypothesis test of the difference two groups means based on the means of two paired samples. Under this test, the two samples are compared in such a way, that the elements in one sample are matched or paired with the elements or paired with the other sample, thereby helping in doing a precise analysis in finding out whether any significant difference exists in the two series.
In our analysis, under paired samples t-test, the two samples are:
- Exam score with online course
- Exam score without online course
Thus, the paired sample t-test has been used to compare the means of the abovementioned two variables. As such, it helps in finding out if there is a statistically significant difference between the Exam score with online course at which trading took watched video on Moodle tool and the Exam score without online course.
For the paired samples t-test, we state the null hypothesis that there is no significant mean difference between the two series and hence the two series do not statistically differ the alternate hypothesis is the two series differ from each other significantly. So, the hypothesis can be stated as follows:
H0: m =0
H1: m ≠0
Where, mean is difference between the two series. The alternative is two-tailed at a signification level of 5% (α=0.05).
That this study used SPSS to conduct the paired samples t-test. The SPSS output is shown in this table which views that difference Exam score with online course and Exam score without online course is significant or not.
TABLE 2 Paired Samples Statistics |
|||||
|
Mean |
N |
Std. Deviation |
Std. Error Mean |
||
|
Pair 1 |
WithoutOnlineCourse |
16.0000 |
30 |
6.44874 |
1.17737 |
|
WithOnlineCourse |
21.3667 |
30 |
8.15997 |
1.48980 |
|
In the Paired Samples Statistics Box, the mean for the WithoutOnlineCourse is 16. The mean for the WithOnlineCourse is 21.3667. The standard deviation for the WithoutOnlineCourse is 6.44874 and for the WithOnlineCourse, also 8.15997 . The number of participants in each condition (N) is 30.
Paired Samples Test Box
This is the next box as will views. It contains info about the paired samples t-test that the conducted. There will be most interested in the value that is in the final column of this table. Take a look at the Sig. (2-tailed) value.
TABLE 3 Paired Samples Correlations |
||||
|
N |
Correlation |
Sig. |
||
|
Pair 1 |
WithoutOnlineCourse & WithOnlineCourse |
30 |
.160 |
.399 |
Correlation– This is the correlation coefficient of the pair of variables indicated. This is a measure of the strength and direction of the linear relationship between the two variables. The correlation coefficient can range from -1 to +1, with -1 indicating a perfect negative correlation, +1 indicating a perfect positive correlation, and 0 indicating no correlation at all. (A variable correlated with itself will always have a correlation coefficient of 1.) You can think of the correlation coefficient as telling you the extent to which you can guess the value of one variable given a value of the other variable. The .160 is the numerical description of how tightly around the imaginary line the points lie. If the correlation was higher, the points would tend to be closer to the line; if it was smaller, they would tend to be further away from the line.
Sig– This is the p-value associated with the correlation. Here, correlation is significant at the .05 level.
TABLE 4Paired Samples Test |
|||||||||
|
Paired Differences |
t |
df |
Sig. (2-tailed) |
||||||
|
Mean |
Std. Deviation |
Std. Error Mean |
95% Confidence Interval of the Difference |
||||||
|
Lower |
Upper |
||||||||
|
Pair 1 |
WithoutOnlineCourse – WithOnlineCourse |
-5.36667 |
9.55739 |
1.74493 |
-8.93545 |
-1.79788 |
-3.076 |
29 |
.005 |
Std Error Mean– Standard Error Mean is the estimated standard deviation of the sample mean. This value is estimated as the standard deviation of one sample divided by the square root of sample size: 9.55739/sqrt(30) = . 1.74493. This provides a measure of the variability of the sample mean.
Sig (2-Tailed) value
This value will tell us if the two condition Means are statistically different. Often times, this value will be referred to as the p value. In this example, the Sig (2-Tailed) value is 0.005.
If the Sig (2-Tailed) value is greater than 0.05
It is means there is no statistically significant difference between two groups. it can conclude that the differences between condition Means are likely due to chance and not likely due to the IV manipulation.
If the Sig (2-Tailed) value is less than or equal to .05.
You can conclude that there is a statistically significant difference between your two conditions. You can conclude that the differences between condition Means are not likely due to change and are probably due to the IV manipulation.
What does the t-value and two-tailed P-value how do they compare to each other? Is this information “significant” enough to say that with online course came from the same family as without online course?
A two-tailed P-value of 0.6, for example, would mean that there is a 0.6 (or 60%) chance that the two groups of score come from the same group. In other words, there is a 60% chance that the average score of the exam in each group is the same and would say that there is no significant difference between the ages of the two populations.
The traditionally accepted P-value for something to be significant is P < 0.05. So if there is less than a 5% chance that two groups came from the same group, then it is considered a significant difference between the two groups.
Larger t-values translate into smaller P-values. So the larger the t-value is the more likely the difference is significant. A “critical t-value” is the minimum t-value you need in order to have P < 0.05. If t-value is greater than or equal to the critical t-value, then will have a significant difference.
4.4 Testing Hypothesis:
The results as reported in Table indicated there was statistically significant difference for method of instruction, p-value=0.005. Therefore, Null Hypothesis was rejected. There was a statistically significant difference in exam scores of without online course group and online course group mathematic courses, when adjusting for the effect of exam scores. Therefore was statistically significant difference in exam.
4.5 Finally
With online course and without online course test scores of the group was compared. The average score in with online course was 21.3667, whereas the average score in the without online course was 16. This can be seen in figure 3. The P value two-tail test is used to control if the mean score of with online course and without online course tests are significantly different. Is the learning mathematic course with online course significantly better or worse? The P value is greater than t value which establishes that scores in with online course test are significantly different and higher than the scores in without online course test. This supports the premise that with online course Choices is effective instruction strategy to impart the importance of Hawler Institute of computer and concept of video technology.
Therefor there was a statistically significant difference in exam scores, decidedly two methods
The analysis of tests responses shows that the instruction methodology of imparting the concept of technical debt through with online course choices is effective. At the following figure 4.4 as shown rate of students participate with online course increased.
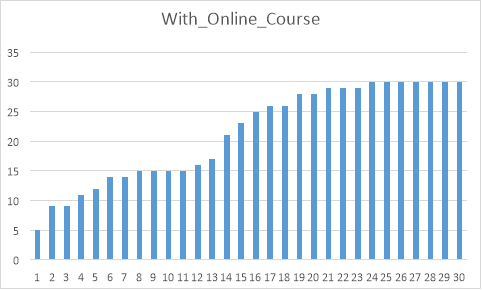
Figure 7 online course
CHAPTER 5
CONCLUSION
In view of the writing and the discoveries of the current study, a few conclusions can be drawn concerning developmental mathematics online course. The results of this study indicate that video technology can using for development mathematic online course. The mere presence of video online course does improve student learning mathematic lecture. Students have an interest in utilizing technology for a variety of purposes including academics. Online video course have the potential to be useful tools to improve learning. They provide educators the opportunity to create and record courses then upload on Moodle tool. Also give opportunity to student for participate mathematic course without missing lecture.
SUMMARY
Many students enter college without the mathematics skills and knowledge to successfully meet their educational and career goals (National Center for Educational Statistics, 2003b). Most colleges and universities offer developmental mathematics courses and other services to prepare these students for college-level mathematics courses. Developmental mathematics courses have been taught with the traditional lecture method used for years in most college-level courses (Armington, 2003; Kinney and Kinney, 2003; Maxwell, 1979; Miles, 2000; Roueche and Kirk, 1974). Educators are concerned about the low pass rates (Boylan, Bonham, and White, 1999; Trenholm, 2006; Waycaster, 2001; Wright, Wright, and Lamb, 2002) and are exploring alternative instructional approaches in order to increase the number of students who stay in school or institute, pass a class mathematic course, and graduate. Video mathematic online course make conceivable a variety of new showing methodologies, permitting students to have decisions about when, where, and how they learn math. The review of literature indicated a need for further studies on the impact of video record and uploaded on Moodle tool on the learning of developmental mathematics course. The purpose of this study was to investigate differences in the academic performance of students enrolled in a developmental mathematics course using traditional instruction with mathematic online course.
Students’ mathematics course at the end of the course related to be exam at the Institute Hawler for Computer. Therefore, the exam, which measured mathematical performance with online course with without online course, was used as the Hypothesis in the analysis. T-Test: Paired Two Sample for Means adjusted the means of the exam paired groups.
Null Hypothesis case there was significance difference in the mathematics lecture for developmental mathematics course using traditional lecture and video record and uploaded on Moodle then students participate with watched video online. The independent variable was method of instruction, and the dependent variable was the exam score. At the .05 level of significance, there was significant difference between the exam scores of students who completed a traditional developmental math course and watched video online course on Moodle tool.
DISCUSSION
LIMITATIONS
RECOMMENDATIONS FOR FURTHER STUDY:
The following recommendations for further investigation were based on the findings of this study. To further validate the findings of this research, the study should be replicated with a larger sample and in other developmental subject courses.
Also recommended add same technology for learning in the institute Hawler for computer.
REFERENCES
Surname: KHUDHUR
Name: WSHYAR OMAR
Place and Date of Birth: TaqTaq, Erbil Kurdistan Iraq /1ST July 1983.
Gender: MALE
Address: – STATE IRAQ, ERBIL – GOVERNORATE, KOYA CITY
Language: KURDISH, ENGLISH
Marital Status: MARRIAGE
E-mail: [email protected]
Mobile Phone: +90 548 873 7683, +964 772 159 7828
B.Sc. Software Engineering, Koya University Erbil, Iraq
The post Quantitative Comparison of Learning Environment Effect appeared first on mynursinghomeworks.
[ad_2]
Source link